
Inside the Compiler: Trees, Parsing, and That First Assembly Glimpse
Ever wondered how the compiler knows your code is broken before it even tries to run it?

Introduction
In our last article, we explored the preprocessor—that copy-paste engine handling #include and #define. We saw how header guards prevent redefinition chaos. Now it’s time to peek inside the compiler itself.
The compiler’s job isn’t just to translate your code into machine instructions. First, it has to understand your code. That means parsing it into a tree structure called an Abstract Syntax Tree (AST). This tree is how the compiler checks syntax, resolves types, and catches errors like “variable x used before declaration.” Once the tree’s valid, the compiler walks through it and generates assembly code—human-readable instructions that the assembler will turn into binary.
In this part, we’ll visualize an AST (using g++‘s --fdump-tree-all-graph flag), then generate assembly output with -S(full form: --assemble). You’ll see your C++ code transformed into mov, call, and other low-level instructions. It’s like watching a magic trick in reverse—you see exactly how the illusion works.
Next up, we’ll roll up our sleeves and generate some trees and assembly.
How the Compiler Parses Code: Building an AST
When you write int x = 2 + 2;, the compiler doesn’t just blindly convert it to machine code. It builds a tree:
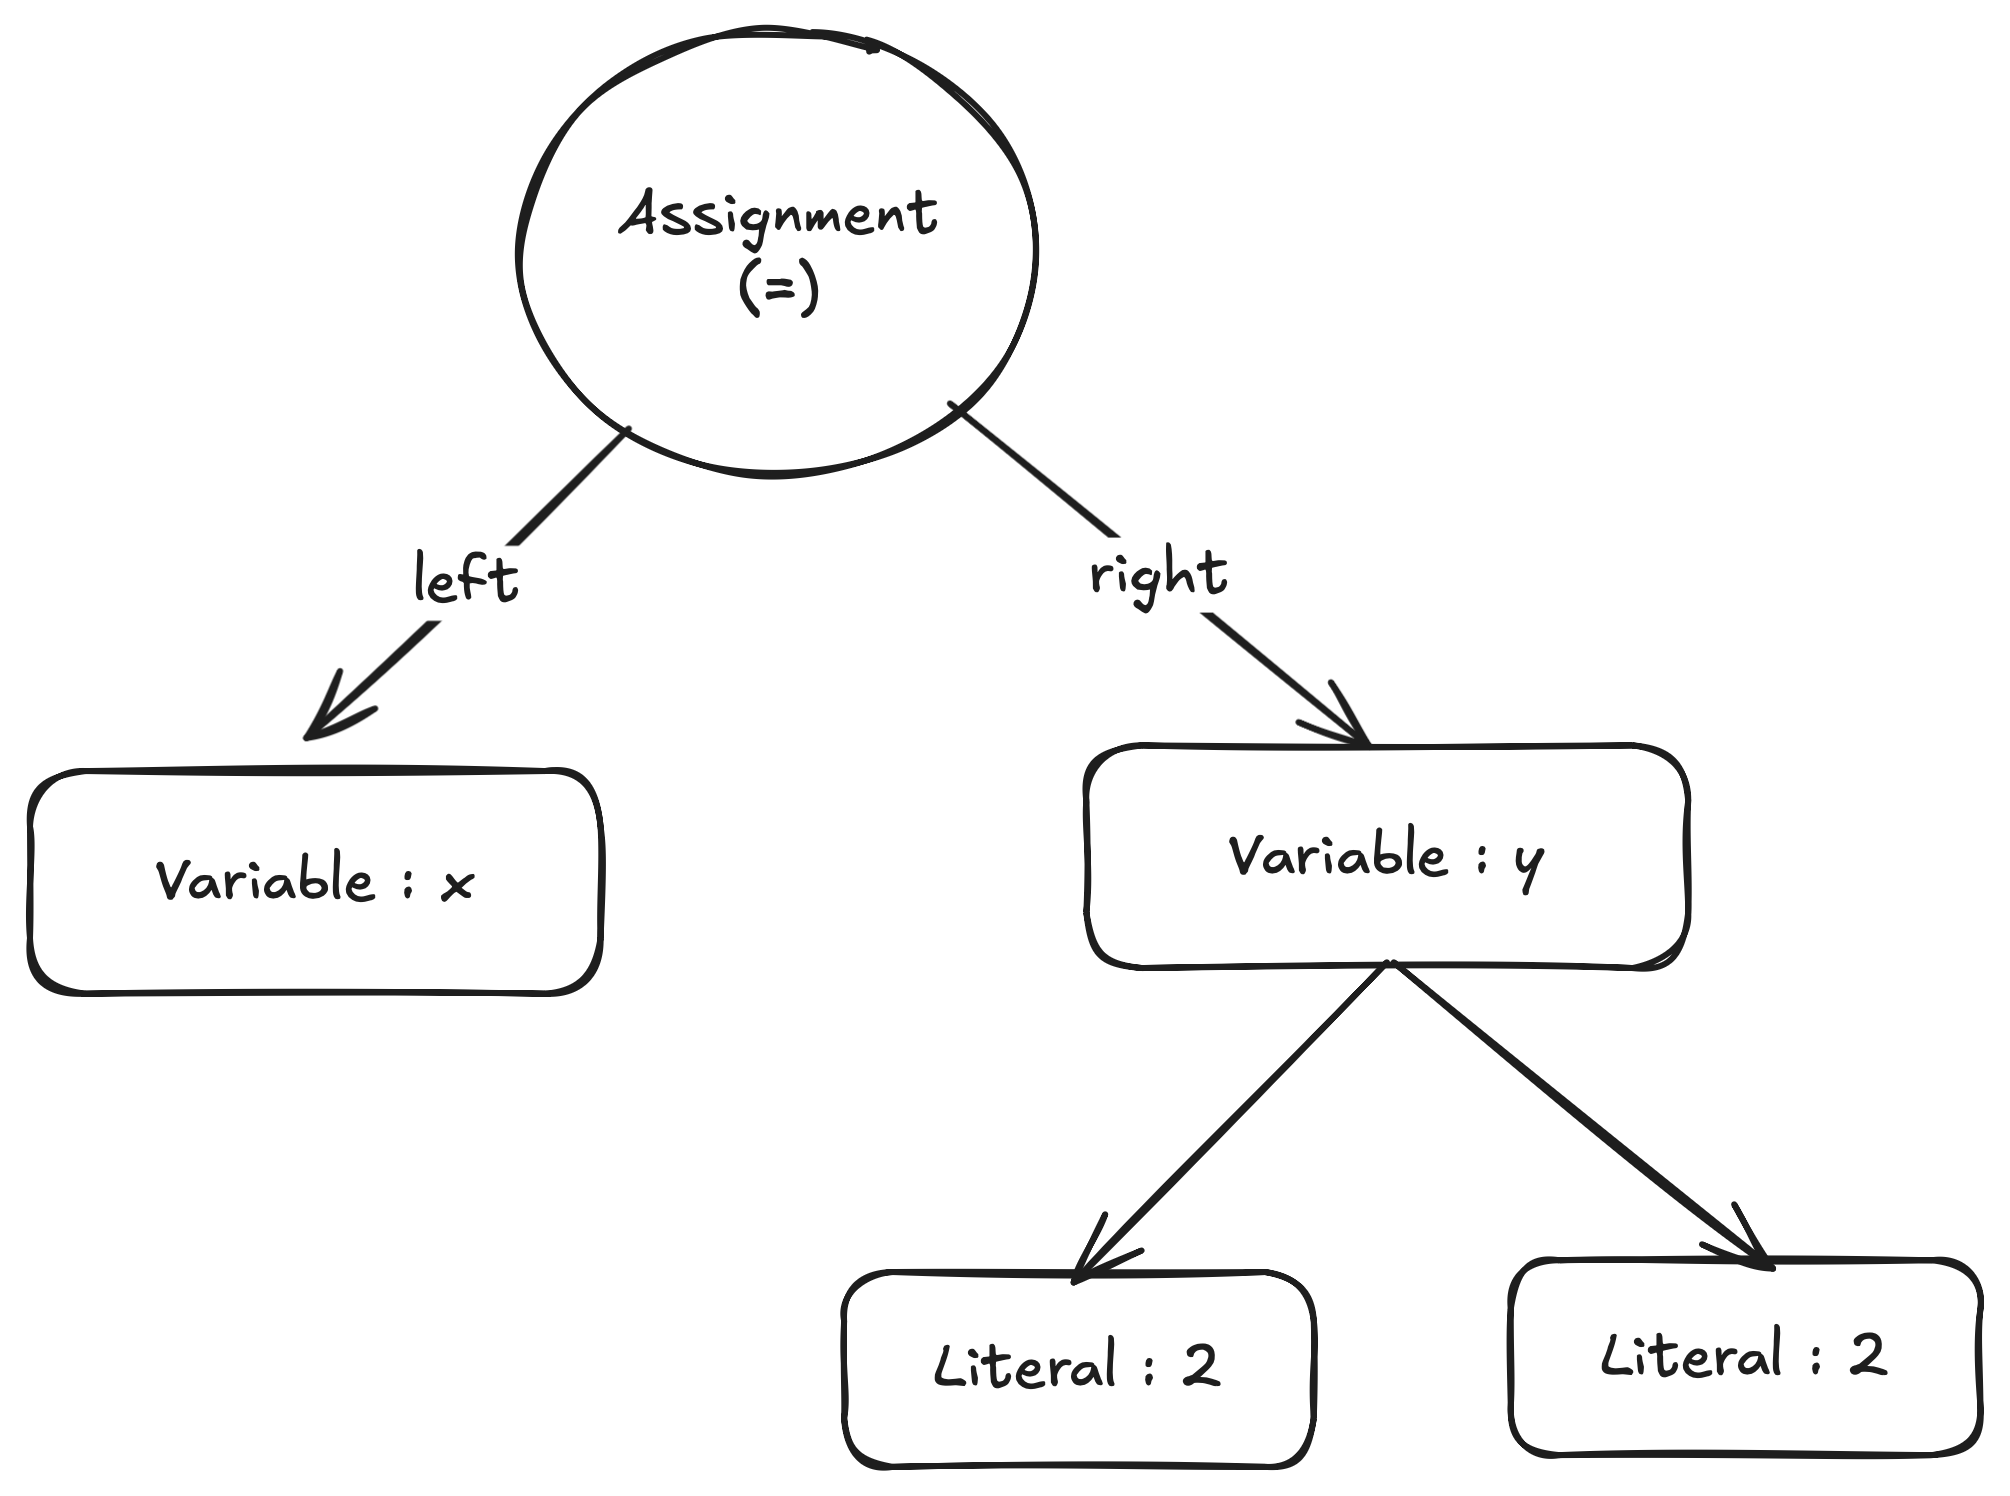
An Abstract Syntax Tree for x = 2 + 2. The compiler traverses this to generate code and catch errors.
The compiler walks this tree: it sees x, then the = operator, then the + expression, then the two 2 literals. If you’d written x = 2 +; (missing operand), the tree can’t form, and the compiler throws a syntax error. If x were undeclared, it catches that during type-checking. This is how compilers give you helpful errors like “expected ; before }“ or “use of undeclared identifier.”
Let’s see a real AST. Start with our project files from Part 1. If you don’t have them handy:
source.hpp:
// source.hpp
#ifndef SOURCE_HPP
#define SOURCE_HPP

int add(int a, int b);

#endifsource.cpp:
// source.cpp
int add(int a, int b) {
    return a + b;
}main.cpp:
// main.cpp
#include "source.hpp"

int main() {
    int result = add(2, 3);
    return 0;
}
Now compile with tree dumping enabled:
g++ -g --fdump-tree-all-graph main.cpp source.cpp -o myprogram
The -g flag adds debugging info (optional but helpful). The --fdump-tree-all-graph flag tells g++ to dump every intermediate tree stage as .dot files (Graphviz format). After running, list your files:
ls *.dotYou’ll see dozens: main.cpp.001t.tu.dot, main.cpp.004t.gimple.dot, etc. These represent different compiler passes (tree unification, gimplification, optimization stages). Let’s visualize one. Install Graphviz if you don’t have it:
sudo apt install graphvizPick a file, like main.cpp.004t.gimple.dot, and view it:
xdot main.cpp.004t.gimple.dotYou’ll see a flowchart with nodes like GIMPLE_CALL, RETURN_EXPR, and references to add. It’s dense—compiler internals aren’t meant for casual reading—but you can spot your add(2, 3) call and the return statement. This is the compiler’s internal representation before it generates assembly.
(Note: The exact .dot files generated can vary by g++ version and optimization level. If you don’t see the exact file names above, just pick any .dot file and explore. The concepts hold.)
From Trees to Assembly: First Glimpse of the Machine
Now let’s generate assembly. Use the -S flag (full form: --assemble) to stop compilation after producing assembly text:
g++ -S main.cpp -o main.sOpen main.s:
	.file	"main.cpp"
	.text
	.globl	main
	.type	main, @function
main:
.LFB0:
	.cfi_startproc
	pushq	%rbp
	.cfi_def_cfa_offset 16
	.cfi_offset 6, -16
	movq	%rsp, %rbp
	.cfi_def_cfa_register 6
	subq	$16, %rsp
	movl	$3, %esi
	movl	$2, %edi
	call	_Z3addii
	movl	%eax, -4(%rbp)
	movl	$0, %eax
	leave
	.cfi_def_cfa 7, 8
	ret
	.cfi_endproc
Assembly output (trimmed excerpt). Assembly can vary by architecture (e.g., x86 vs. ARM) or distro optimizations—yours might look a tad different, but the concepts hold.
Let’s decode a few lines:
movl $3, %esiandmovl $2, %edi: Move the literals3and2into registers (esiandediare where x86-64 passes function arguments).call _Z3addii: Call theaddfunction. The mangled name_Z3addiiis C++’s name-mangling foradd(int, int).movl %eax, -4(%rbp): Store the return value (in registereax) into the local variableresult(at an offset from the base pointerrbp).movl $0, %eax: Set the return value ofmainto0.ret: Return frommain.
You don’t need to memorize this (unless you’re writing assembly by hand, in which case, respect). The point is: your high-level add(2, 3) became a sequence of register moves and a function call. This is the bridge between human code and machine code.
Now generate assembly for source.cpp:
g++ -S source.cpp -o source.sLook at source.s:
	.file	"source.cpp"
	.text
	.globl	_Z3addii
	.type	_Z3addii, @function
_Z3addii:
.LFB0:
	.cfi_startproc
	pushq	%rbp
	movq	%rsp, %rbp
	movl	%edi, -4(%rbp)
	movl	%esi, -8(%rbp)
	movl	-4(%rbp), %edx
	movl	-8(%rbp), %eax
	addl	%edx, %eax
	popq	%rbp
	ret
	.cfi_endproc
The addl %edx, %eax instruction does the actual addition. Again, the exact instructions depend on your architecture and optimization flags (try -O2 for optimized assembly—it’s much shorter).
Architecture and Distro Notes
Assembly is architecture-specific. On x86-64 (Intel/AMD), you see instructions like movq, call, ret. On ARM (Raspberry Pi, Apple M1/M2), you’d see different mnemonics: mov, bl, bx. If you’re on a different platform, your assembly will look different, but the logic is the same—load arguments, call functions, return results.
Distros also vary. Ubuntu with g++ 11 might produce slightly different code than Fedora with g++ 13. Optimization levels change things dramatically (-O0 is verbose, -O3 is aggressive). Don’t worry if your output doesn’t match mine exactly. The patterns are what matter.
Why This Matters
Seeing assembly helps you:
Understand performance: Want to know why your loop is slow? Look at the assembly—are you doing unnecessary memory loads?
Debug compiler bugs: Sometimes the compiler generates wrong code. Assembly is your proof.
Write inline assembly: For ultra-low-level work (device drivers, cryptography), you might need
asmblocks. Knowing how the compiler translates helps you write efficient inline assembly.
Most of the time, you won’t read assembly. But knowing it’s there, and how to generate it, is a superpower.
Wrapping It Up
The compiler parses your code into an Abstract Syntax Tree, checks it for errors, then walks that tree to generate assembly. We’ve seen ASTs visualized as Graphviz diagrams and assembly as text files. It’s the middle stage of compilation—after preprocessing, before assembling into binary.
Try this: Add an intentional syntax error to main.cpp (like int result add(2, 3);) and compile. Watch the error message. Then fix it, generate assembly, and browse through main.s. See if you can spot the function call. Change add(2, 3) to add(10, 20) and regenerate—notice how the immediate values change.
Next time, we’ll take that assembly text and run it through the assembler to produce object files (.o). We’ll use objdump to peek inside those binary blobs and see the symbols the linker will use. We’re getting close to the final executable.
Really enjoying this series. For what it's worth, on my Fedora system the command needed to be `dot` instead of `xdot`. Would love to get more comfortable reading assembly!